
Instagram Competitor Analysis: How to Do It and What to Compare

Everyone checks a competitor's profile now and then. The trouble is that a quick scroll usually turns into a gut feeling: "they're crushing it," "their carousels get way more engagement," "they post every single day." Without the numbers side by side, it's hard to know whether that feeling is real and, more importantly, what to do about it.
A solid Instagram competitor analysis turns that curiosity into a routine. You decide who to benchmark against, choose the numbers that matter, record everything the same way every month and use the results to plan campaigns, adjust your posting cadence and show clients where the brand stands.
This guide walks through the full method: the formula, a worked example, a 5-step process and a ready-to-copy template. It also spells out what this kind of analysis can't show you. That's the best place to start.
What Is Social Media Competitor Analysis?
Social media competitor analysis is the regular comparison of your brand's public numbers with those of similar brands, so you can understand your relative performance and make better content decisions. On Instagram, that means tracking followers, growth, posting frequency and post reactions for a fixed group of profiles.
Three ideas define a good analysis:
- It's comparative. A number on its own says very little. A 2% engagement rate only means something once you know what the brands in your market are getting.
- It's ongoing. A one-off snapshot doesn't show a trend. The value comes from repeating the same read with the same criteria.
- It's public. You only see what Instagram shows to everyone or makes available for professional accounts. A competitor's private data, such as reach and Story results, stays out of view.
Don't confuse it with social listening, which tracks what people say about a brand across the web. Competitor analysis looks at profile performance; social listening looks at the conversation. They're different jobs, and this guide covers only the first one.
Why Should You Track Competitors on Instagram?
You track competitors to get a benchmark, spot content opportunities and back up decisions with data instead of hunches. In practice, the analysis supports four areas of your marketing routine.
| Area | Question the analysis answers | Example decision |
|---|---|---|
| Benchmarking | Is my engagement above or below the market? | Set a realistic engagement goal for the quarter |
| Planning | How often do competitors post each week? | Adjust the cadence of your content calendar |
| Campaigns | What changed in a competitor's numbers during a campaign? | Launch your seasonal push earlier or give it more weight |
| Client reporting | How is the brand doing compared with its peers? | Show relative progress, not just absolute numbers |
For agencies, that last point carries a lot of weight. A client who grew followers by 1% this month might see that as a weak result. If their three main competitors stayed flat over the same period, the story changes. Competitor data gives your report context.
Which Metrics Should You Compare Across Instagram Accounts?
Compare five groups of numbers: audience size, growth, posting frequency, average reactions per post and engagement per follower. Together, they show who's big, who's growing, who posts more and who gets the strongest response from their audience.
| Metric | What it shows | Watch out for |
|---|---|---|
| Followers | Audience size | A big following doesn't mean an active audience |
| Follower change over 30 days | Growth pace | Giveaways and paid campaigns distort spikes |
| Posts per week | Production pace | More posts don't guarantee better results |
| Average likes | Quick reaction to content | Accounts can hide like counts |
| Average comments | Conversation generated | Giveaways inflate comments |
| Average views | Video and Reel consumption | Depends on each profile's format mix |
| Engagement per follower | Response relative to audience size | The fairest metric for profiles of different sizes |
Two rules apply to every metric:
- Use the same criteria for every profile, including your own. If you measure competitors on their last 25 posts, measure your account the same way.
- Record the date of each read. Instagram numbers change every day. Without a date, there's no real comparison.
Notice what's missing from the table: competitors' reach, impressions, saves and Story performance. Those numbers aren't public, so they have no place in an honest comparison.
How Do You Calculate Engagement per Follower?
Add the average likes and average comments per post, then divide by the number of followers: engagement per follower = (likes + comments) / followers. Multiply by 100 if you want the result as a percentage.
The advantage of this formula is that it puts profiles of very different sizes on the same scale. A huge account almost always has more likes in absolute terms; engagement per follower shows who drives more response relative to their audience.
Hypothetical example (numbers made up purely to illustrate the calculation):
| Profile (hypothetical) | Followers | Average likes | Average comments | Calculation | Engagement per follower |
|---|---|---|---|---|---|
| Brand A | 20,000 | 380 | 20 | (380 + 20) / 20,000 | 0.020 = 2.0% |
| Brand B | 5,000 | 180 | 20 | (180 + 20) / 5,000 | 0.040 = 4.0% |
| Your brand | 10,000 | 260 | 40 | (260 + 40) / 10,000 | 0.030 = 3.0% |
In this example, Brand A gets twice as many likes as Brand B, but Brand B generates twice the response per follower. Your brand sits in the middle. One possible takeaway: it's worth studying how Brand B engages a smaller audience, rather than just trying to match Brand A's size.
Three things to keep in mind with the formula:
- Use averages from the same set of posts, for example the last 25 posts of each profile.
- If a profile hides its likes, you can't calculate it. Leave the cell empty or mark it with a dash. Never fill it in with zero, because zero would claim that nobody liked anything.
- Compare trends, not just snapshots. A drop from 3% to 2.5% over two months tells you more than the number on any single day.
How Do You Run an Instagram Competitor Analysis in 5 Steps?
Define your goal, choose 3 to 10 comparable profiles, collect the same numbers on the same date, compare them with your own account and turn the results into decisions. Then repeat on the same day every month.
1. Define the Question Your Analysis Needs to Answer
Start with how you'll use it. "Is our posting frequency below the market?" leads to a different analysis than "Did our competitor's campaign work?" Write the question at the top of your spreadsheet. It keeps the report from turning into a list of numbers with no conclusion.
2. Choose Comparable Competitors
Mix three types of profiles:
- Direct competitors: they sell the same product to the same audience.
- Industry leaders: bigger brands that set the standard in your market.
- Similar-sized profiles: accounts with an audience close to yours, which give you the most realistic benchmark.
A group of 3 to 10 profiles is usually enough. Any more and the analysis gets tiring to read and the report hard to explain.
3. Collect the Same Numbers, the Same Way
For each profile, record followers, change over the period, posts per week, average likes, comments and views, and engagement per follower. Always use the same window (for example, the last 25 posts) and note the date.
4. Compare Them With Your Own Account
Put your brand in the same table, measured with the same criteria. Highlight where you're above and below the group average. That's when the good questions come up: "Why do we post twice as often and get less engagement?"
5. Turn the Results Into Decisions
Every analysis should end with one to three concrete actions, each with an owner and a deadline. For example: test one more format per week, rethink a campaign's timing, adjust the quarterly engagement goal. Next month, the analysis itself will show whether the action worked.
Monthly Analysis Checklist
- [ ] The analysis question is written at the top
- [ ] The profiles in the group are the same as last month (or the change was noted)
- [ ] Every number has a read date
- [ ] Your account was measured with the same criteria as the competitors
- [ ] Missing numbers are marked with a dash, not a zero
- [ ] Unusual spikes (giveaway, paid campaign, viral post) were noted
- [ ] The conclusion includes one to three actions, each with an owner and a deadline
How Do You Read the Data Without Drawing the Wrong Conclusions?
Read the numbers together, look for trends over several weeks and always ask what could explain a difference before you copy someone else's strategy. An outlier usually has a specific cause.
Here are some common patterns and what they might mean:
| What you see | Possible reading | Next step |
|---|---|---|
| A competitor gains followers fast, but engagement per follower drops | The audience is growing with less active followers, as often happens with giveaways or paid media | Don't chase follower counts without looking at quality |
| A competitor posts less and gets more engagement | More polished content or content better aligned with the audience | Test posting less often and putting more care into fewer posts |
| Your engagement dropped and so did the group's | A market or platform shift, not just something about your brand | Note it and keep watching before you change everything |
| Your engagement dropped while the group's went up | A sign that something in your strategy has lost steam | Review your recent formats, topics and posting times |
| Comments spike in a single month | Possibly a giveaway or a one-off promotion | Keep the unusual month out of the average |
Keep in mind that the comparison shows what happened, not why. To understand the why, open the profiles and look at the content from that period: formats, topics, campaigns, partnerships. The numbers tell you where to look; the qualitative review explains it.
Which Instagram Competitor Analysis Template Should You Use?
Use a table with one row per profile, the same columns for everyone and the read date in the header. Copy the template below into your spreadsheet and fill it in once a month.
Instagram competitor analysis template — read on MM/DD/YYYY
| Profile | Type (direct, leader, similar size) | Followers | 30-day change | Posts per week | Average likes | Average comments | Average views | Engagement per follower | Notes for the period |
|---|---|---|---|---|---|---|---|---|---|
| Your brand | — | ||||||||
| Competitor 1 | |||||||||
| Competitor 2 | |||||||||
| Competitor 3 | |||||||||
| Group average | — |
Below the table, keep three fixed lines:
- Analysis question:
- Key differences found:
- Decisions (action, owner, deadline):
This format works well in client reports, because it shows the numbers and the conclusion on the same page.
How Do You Track Competitors in PostRite?
In PostRite, the Competitors page puts the public numbers of up to 10 professional Instagram accounts next to your own, measured the same way and refreshed once a day. It sits in the menu, in the Analyze group, and lets you pick a 7, 30 or 90-day period.
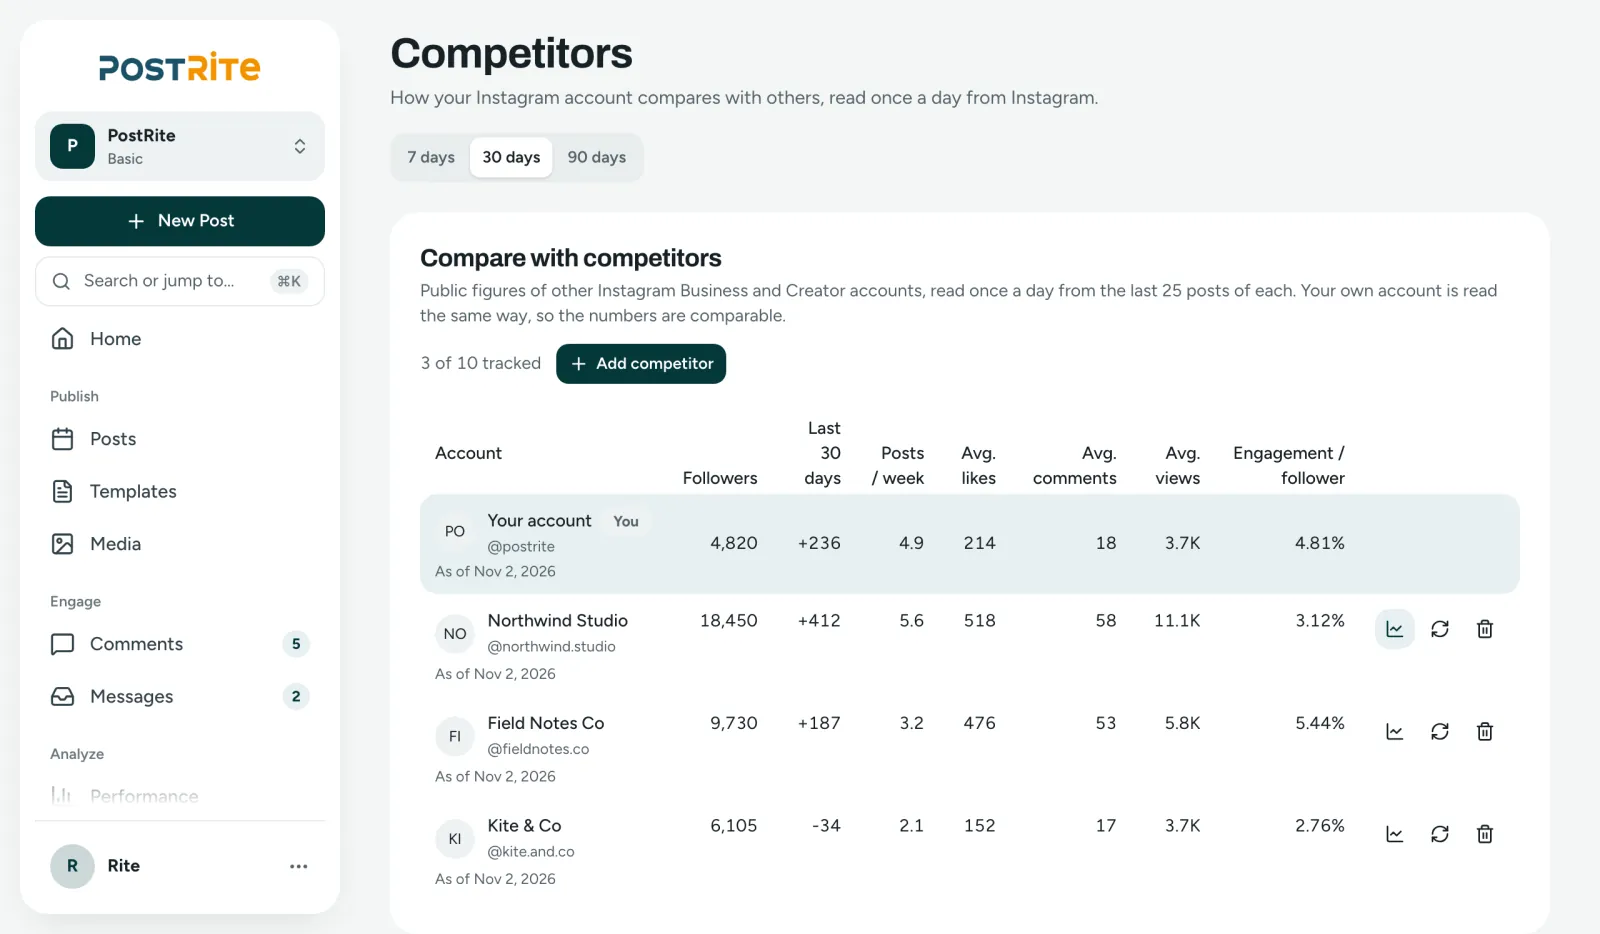
The Competitors page compares your account with each competitor using the same numbers. Example data.
According to the Competitor Analysis documentation, the feature works like this:
- Adding a competitor: open Competitors, type the competitor's Instagram handle and click Add. PostRite reads the account right away and adds a row for it.
- Numbers compared: followers and their change over the last 30 days, posts per week, average likes, comments and views, and engagement per follower (average likes plus comments, divided by followers).
- The same yardstick for everyone: your account is read the same way as each competitor, over the last 25 posts of each.
- Trend chart: shows one of these numbers over time for the competitor you pick. It needs two days of data.
- Refresh now: on top of the daily read, it's available once an hour per competitor.
- On Home: the Competitors block on Home shows your account next to up to three competitors, and the Accounts tab of the Performance page links to the full comparison.
- Team: adding, refreshing or removing a competitor requires the Editor role or above; every member can see the comparison. Roles are described in Roles & Permissions.
For your own account's numbers, such as per-post performance and a ranking of your top posts, the Performance page brings together the metrics described in Analytics. If your team uses an AI assistant connected to PostRite, it can also read this same comparison to help you put together a summary, but adding and removing competitors still happens in the app.
Instagram competitor comparison is included in all three plans, as shown on the pricing page. And because PostRite also schedules posts, you can take the decisions from your analysis straight to the calendar. The step-by-step is in the guide How to Schedule Instagram Posts in 2026.
What Doesn't Instagram Competitor Analysis Show?
The comparison only shows public numbers from professional Instagram accounts: it doesn't cover other networks, personal accounts, Stories, reach or social listening. Knowing these limits keeps you from overpromising in reports and avoids frustration when you use the tool.
| Limit | What it means in practice |
|---|---|
| Instagram only | Today the comparison reads Instagram accounts. TikTok, LinkedIn and other networks aren't included. |
| Requires a Via Facebook connection | Your account must be a Business or Creator account connected through Facebook Login (the Via Facebook option). An account connected with Instagram Login can't read other accounts. Accounts connected before PostRite asked for this permission have to be reconnected in Connected accounts. Both methods are explained in the Instagram guide. |
| Professional competitors only | Instagram only returns data for Business and Creator accounts. A personal account, a handle that doesn't exist, or a renamed or deleted account comes back as Not found. Instagram also withholds some accounts, such as age-restricted ones. |
| Hidden likes | If a competitor hides its like counts, it has no average likes and no engagement per follower. |
| Missing number = dash | When Instagram doesn't report a number, it shows as a dash, never as a zero. |
| Up to 10 competitors | The limit is 10 competitors per organization. |
| Last 25 posts | Averages are based on the last 25 posts. For profiles that post rarely, those 25 posts may cover more than 30 days; in that case, the post count is a minimum and posts per week is calculated over the days actually covered. |
| One read a day | The numbers are as of the date shown. It's not a real-time dashboard. |
| No Stories, no reach, no social listening | The comparison doesn't show competitors' Stories or reach, and it doesn't track mentions or conversations about brands. |
Two details should reassure anyone worried about "spying": PostRite reads public numbers and stores counts only, never captions. It doesn't post, follow or change anything on the other account. Removing a competitor deletes its stored history and changes nothing on Instagram.
Frequently Asked Questions
How do you analyze competitors on Instagram?
Choose 3 to 10 comparable profiles, record the same numbers for all of them (followers, growth, posts per week, average likes, comments and views, engagement per follower), add your own account to the same table and repeat the read every month on the same date. End each analysis with concrete actions.
Which metrics should you compare across Instagram accounts?
The most useful are followers, follower change over the period, posts per week, average likes, comments and views, and engagement per follower. Engagement per follower is the fairest metric for comparing profiles of different sizes.
How do you calculate engagement per follower?
Add the average likes and average comments per post, then divide by the number of followers. Hypothetical example: (380 + 20) / 20,000 = 0.02, or 2%.
Can you track competitors that have a personal account?
No. Instagram only shares numbers for Business and Creator accounts. In PostRite, a personal account comes back as Not found.
Why does my competitor show as "Not found"?
Because Instagram didn't return data for that handle. This happens with personal accounts, handles that don't exist, renamed or deleted accounts and some accounts Instagram withholds, such as age-restricted ones. Check the handle and whether the account is a professional one.
How many competitors can you track?
In PostRite, up to 10 competitors per organization. To add, refresh or remove one, you need the Editor role or above.
How often is the data updated?
Once a day. On top of that, Refresh now is available once an hour for each competitor.
Does the competitor know you're tracking them?
PostRite reads only public numbers and stores counts only, never captions. It doesn't post, follow or change anything on the other account, and removing a competitor changes nothing on Instagram.
Do you need a Business account to compare?
Yes. Your account must be a Business or Creator account connected through Facebook Login (Via Facebook). An account connected with Instagram Login can't read other accounts.
Does it work for TikTok or LinkedIn?
No. Today, PostRite's competitor comparison reads Instagram accounts only.
Conclusion
Competitor analysis isn't about copying whoever is ahead. It's about having a yardstick. With the same numbers, measured the same way on the same date, you stop reacting to impressions and start deciding with context: which posting cadence makes sense, which engagement goal is realistic and what to tell your client in this month's report.
The method works even in a spreadsheet. Pick your group, apply the formula, record the dates, note the limits and close every read with a decision.
If you'd like that comparison ready every day, with your account measured on the same scale as your competitors, PostRite offers a 14-day free trial, no credit card required, so you can build your first Instagram benchmark with your own competitors. Fewer hunches. Better decisions.